
Aggravated assault
Monthly rate per 100,000, 2024 Q3–2025 Q2.

City-to-city crime-rate comparisons with Memphis clearly marked in each chart.
These charts compare Memphis with other cities using rates per 100,000 residents so cities of different sizes can be compared more meaningfully.
Not every city reports every offense, and source data can be revised. A city’s position in one chart should not be treated as an overall ranking of public safety.
Monthly rate per 100,000, 2024 Q3–2025 Q2.
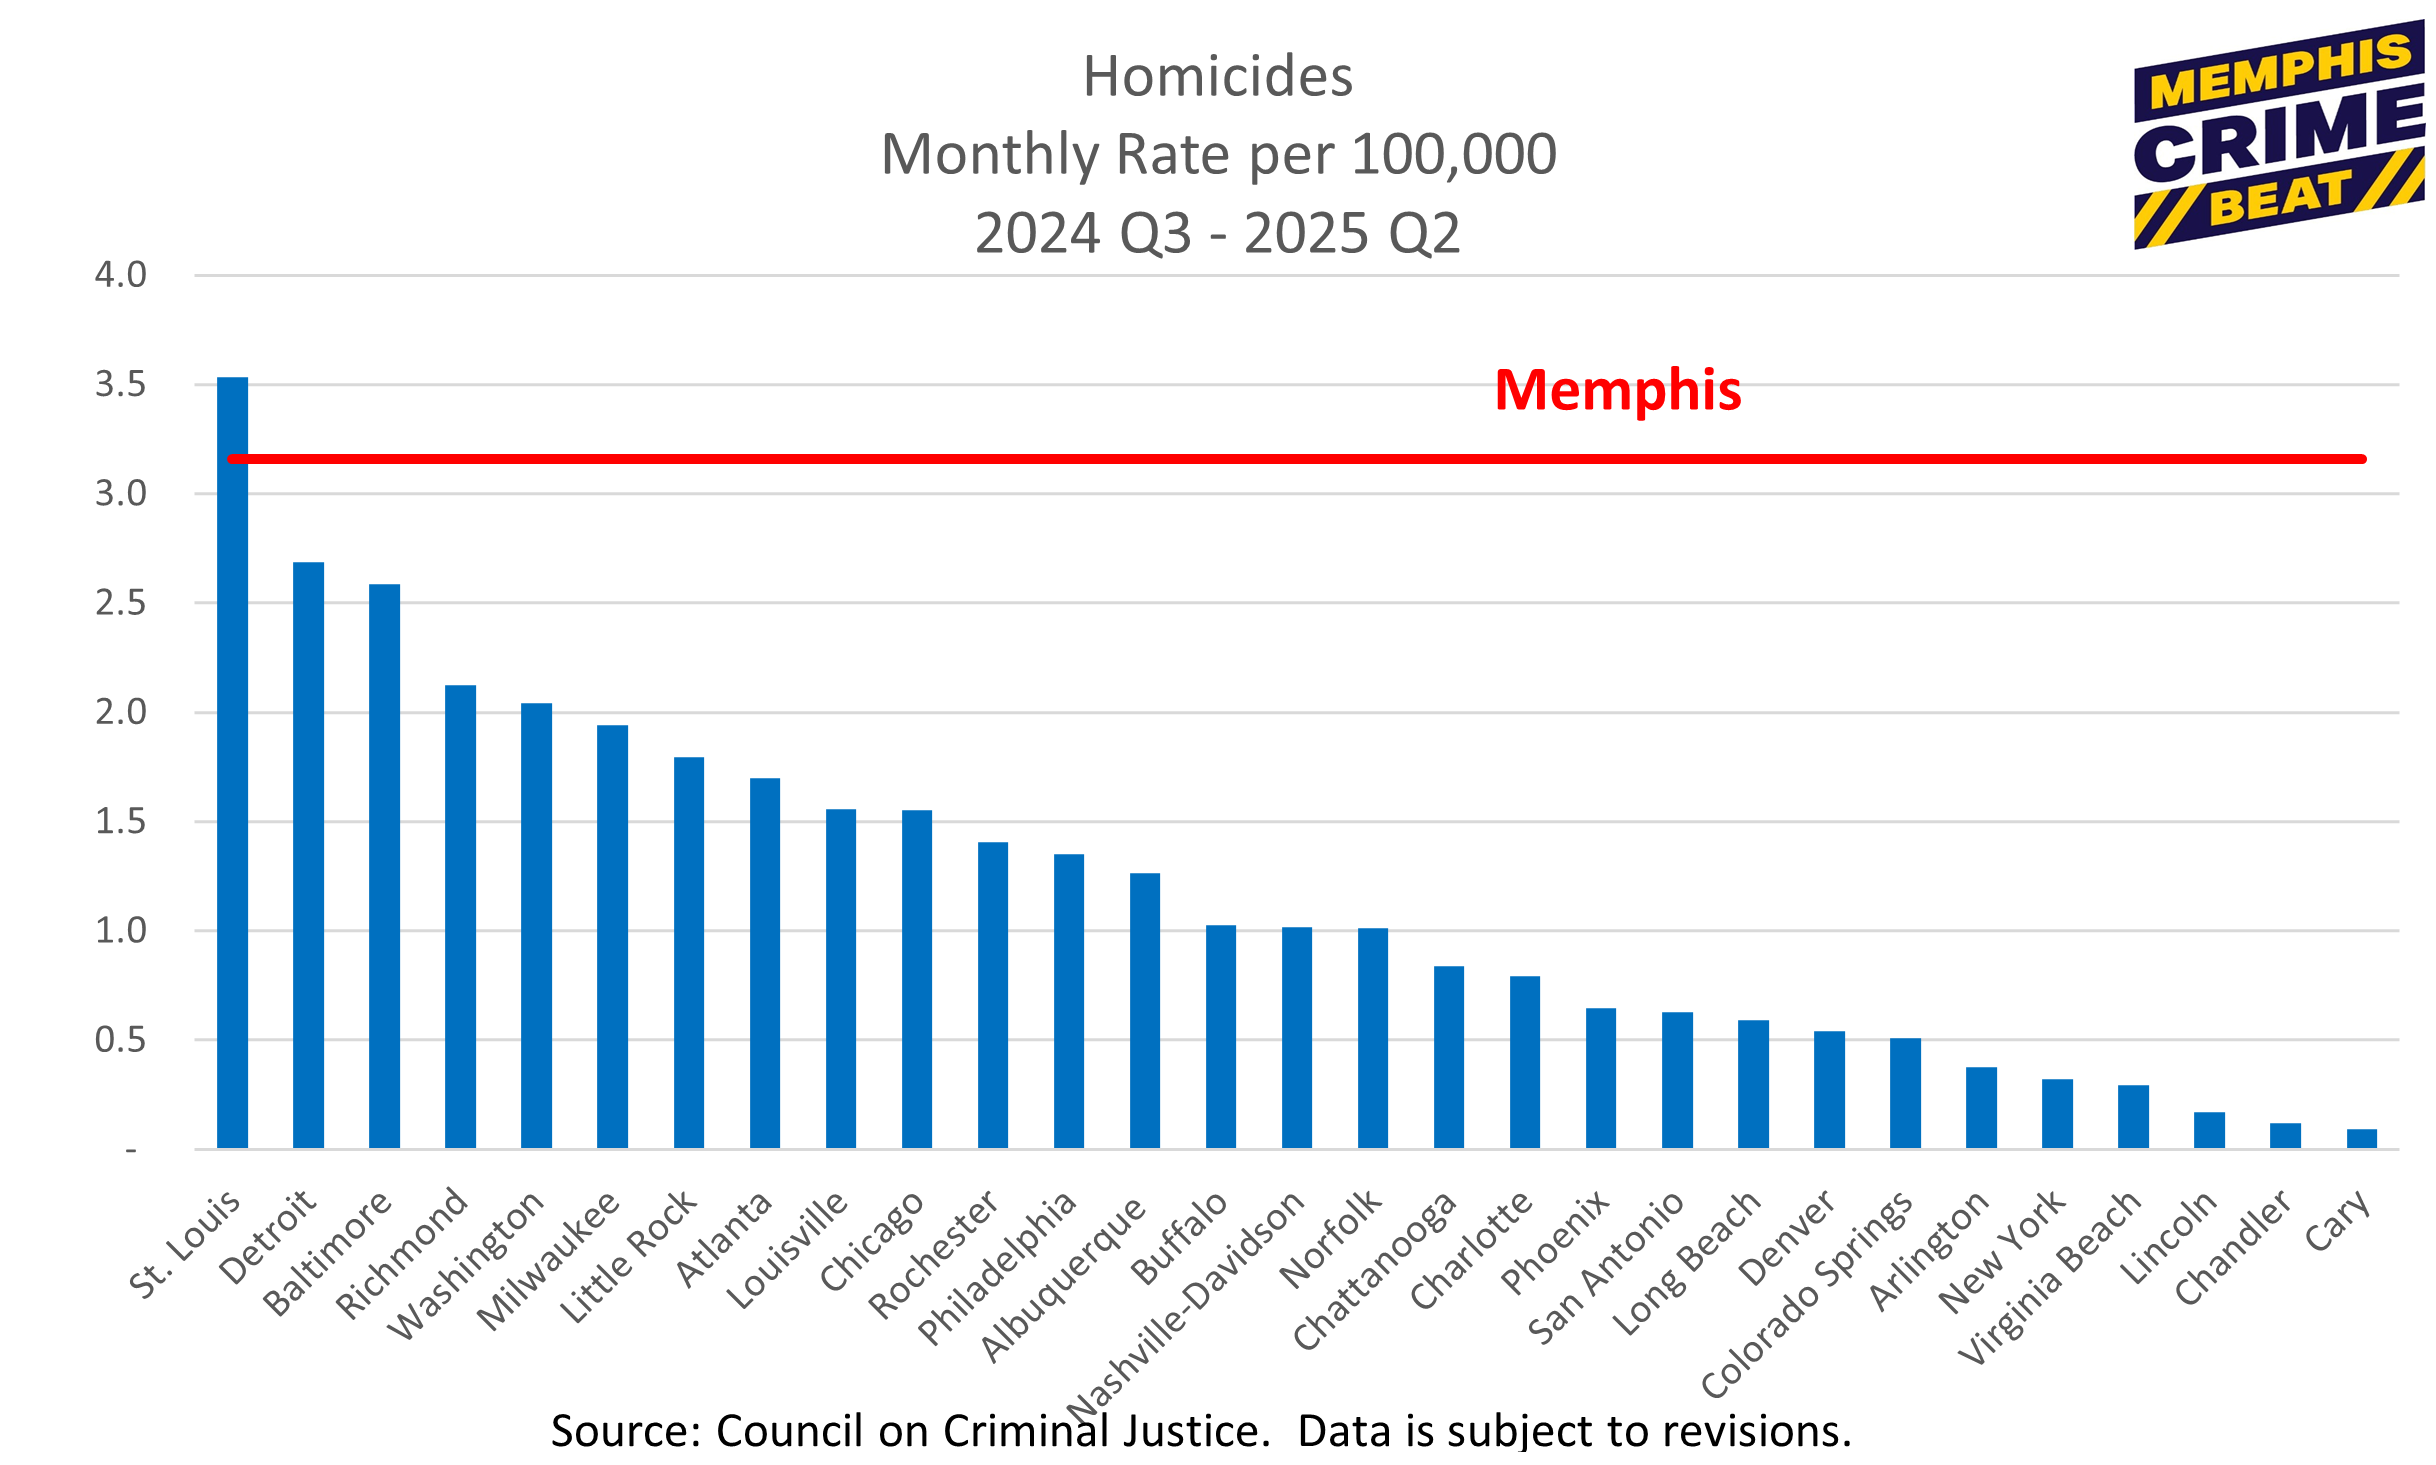
Monthly rate per 100,000 across reporting cities.
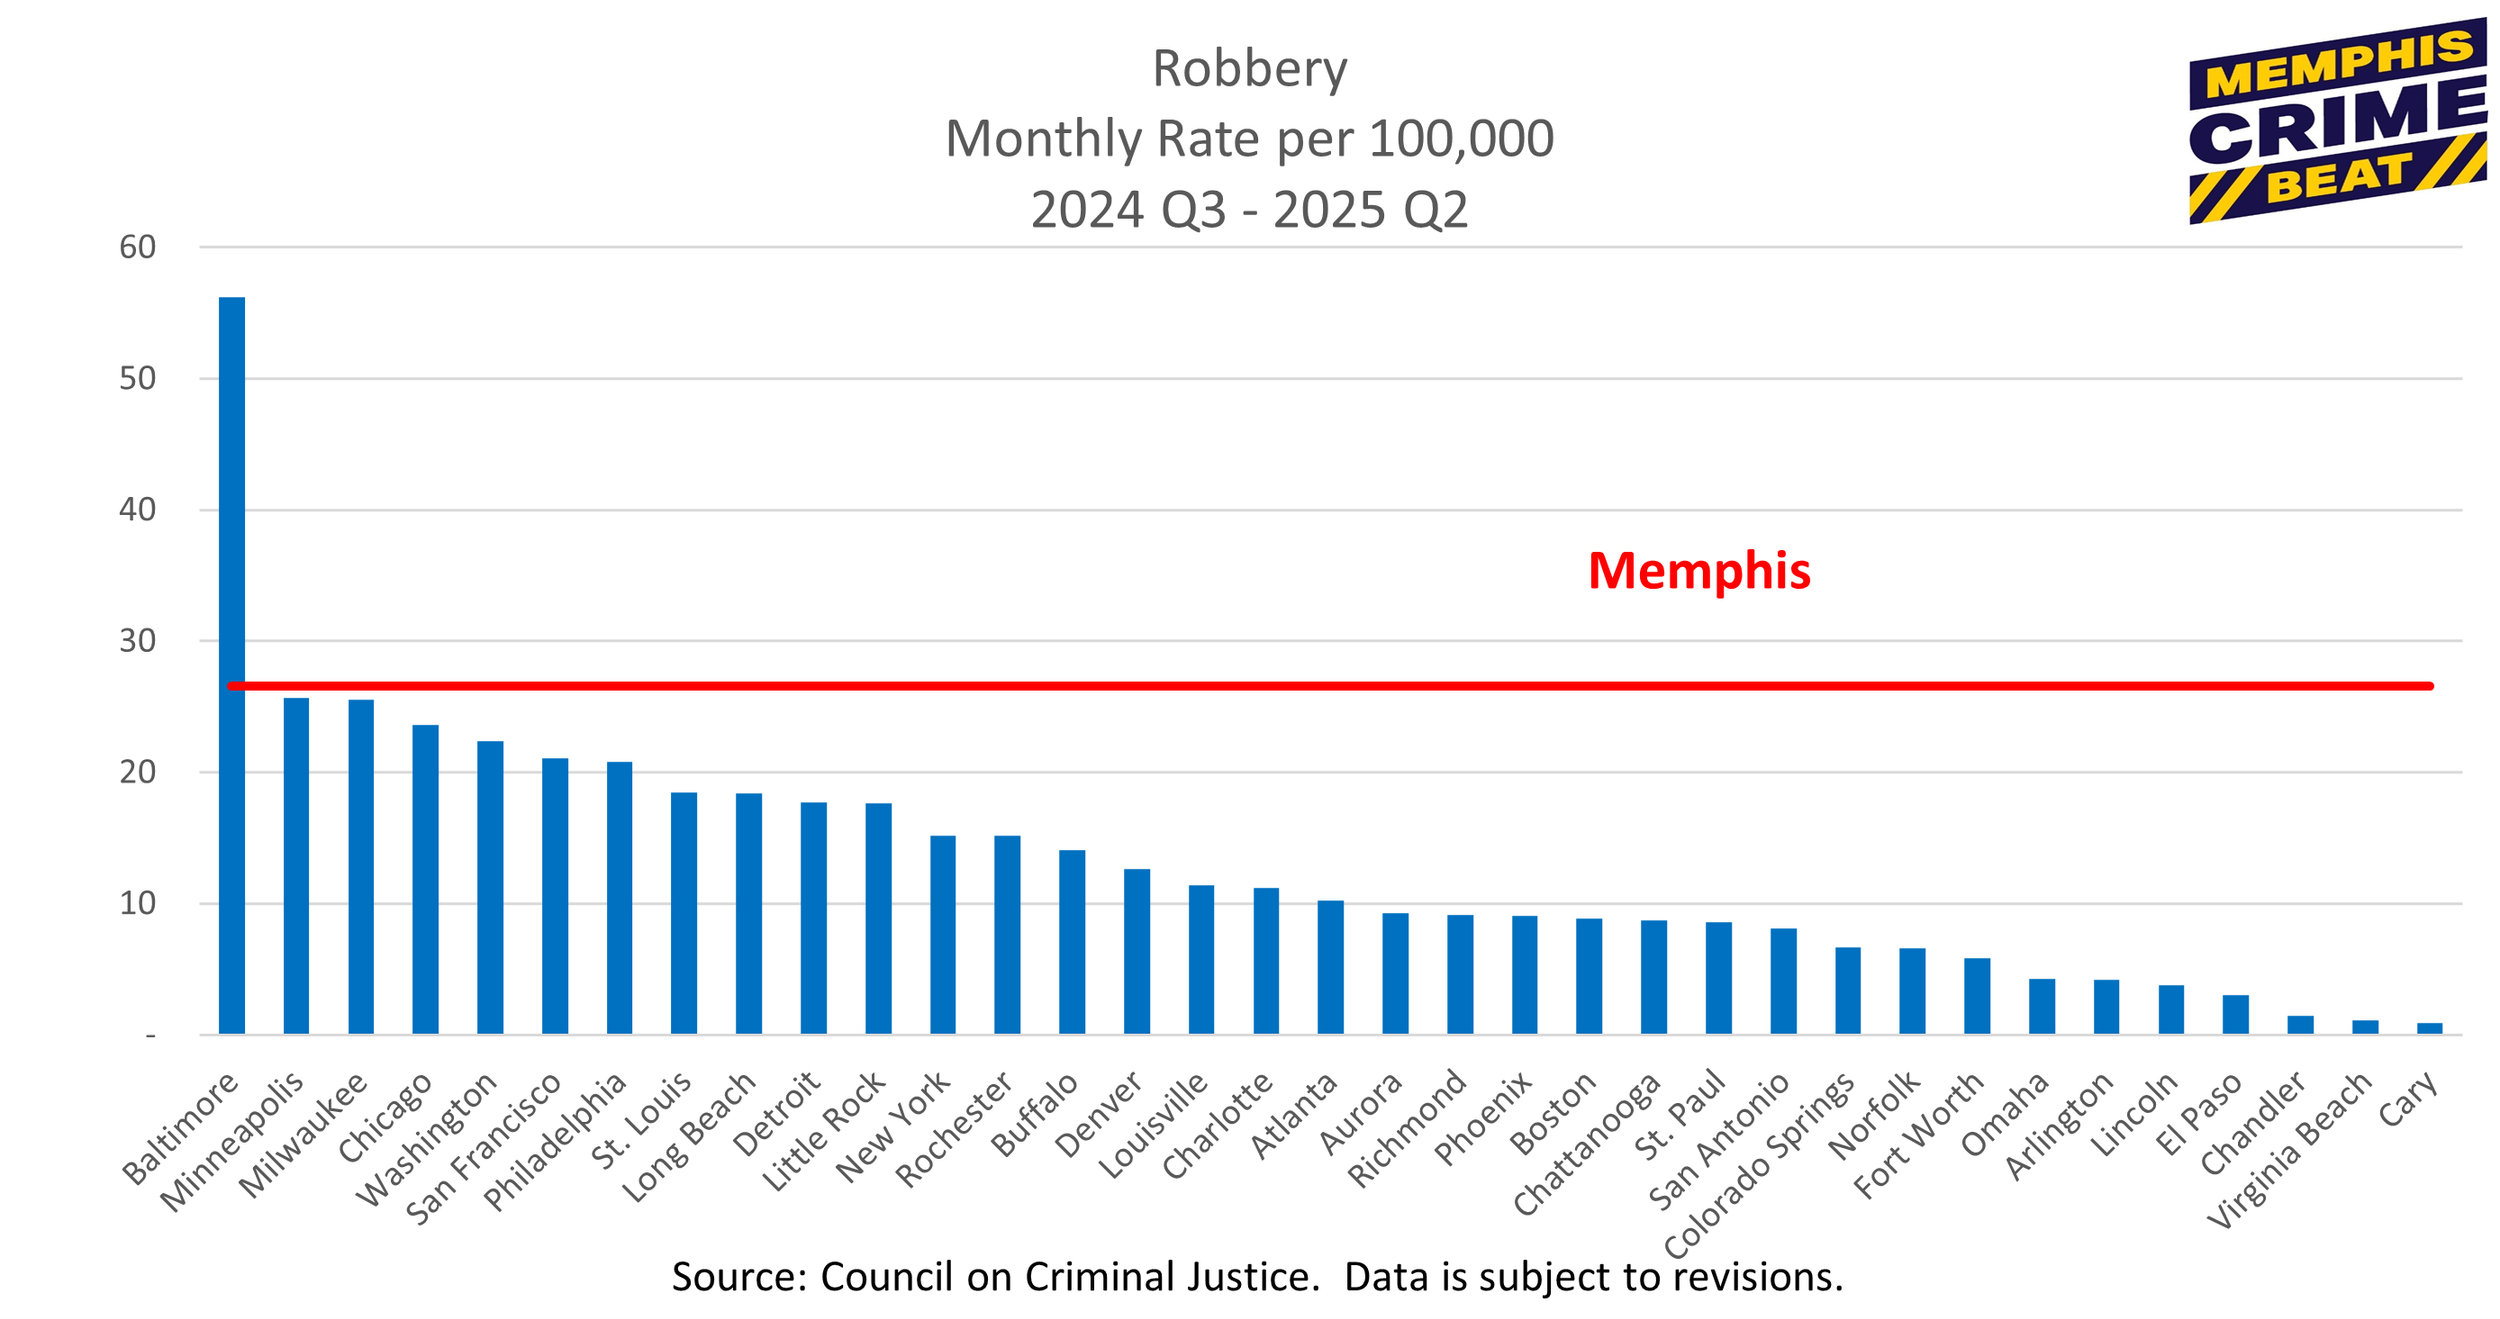
Monthly rate per 100,000 across reporting cities.
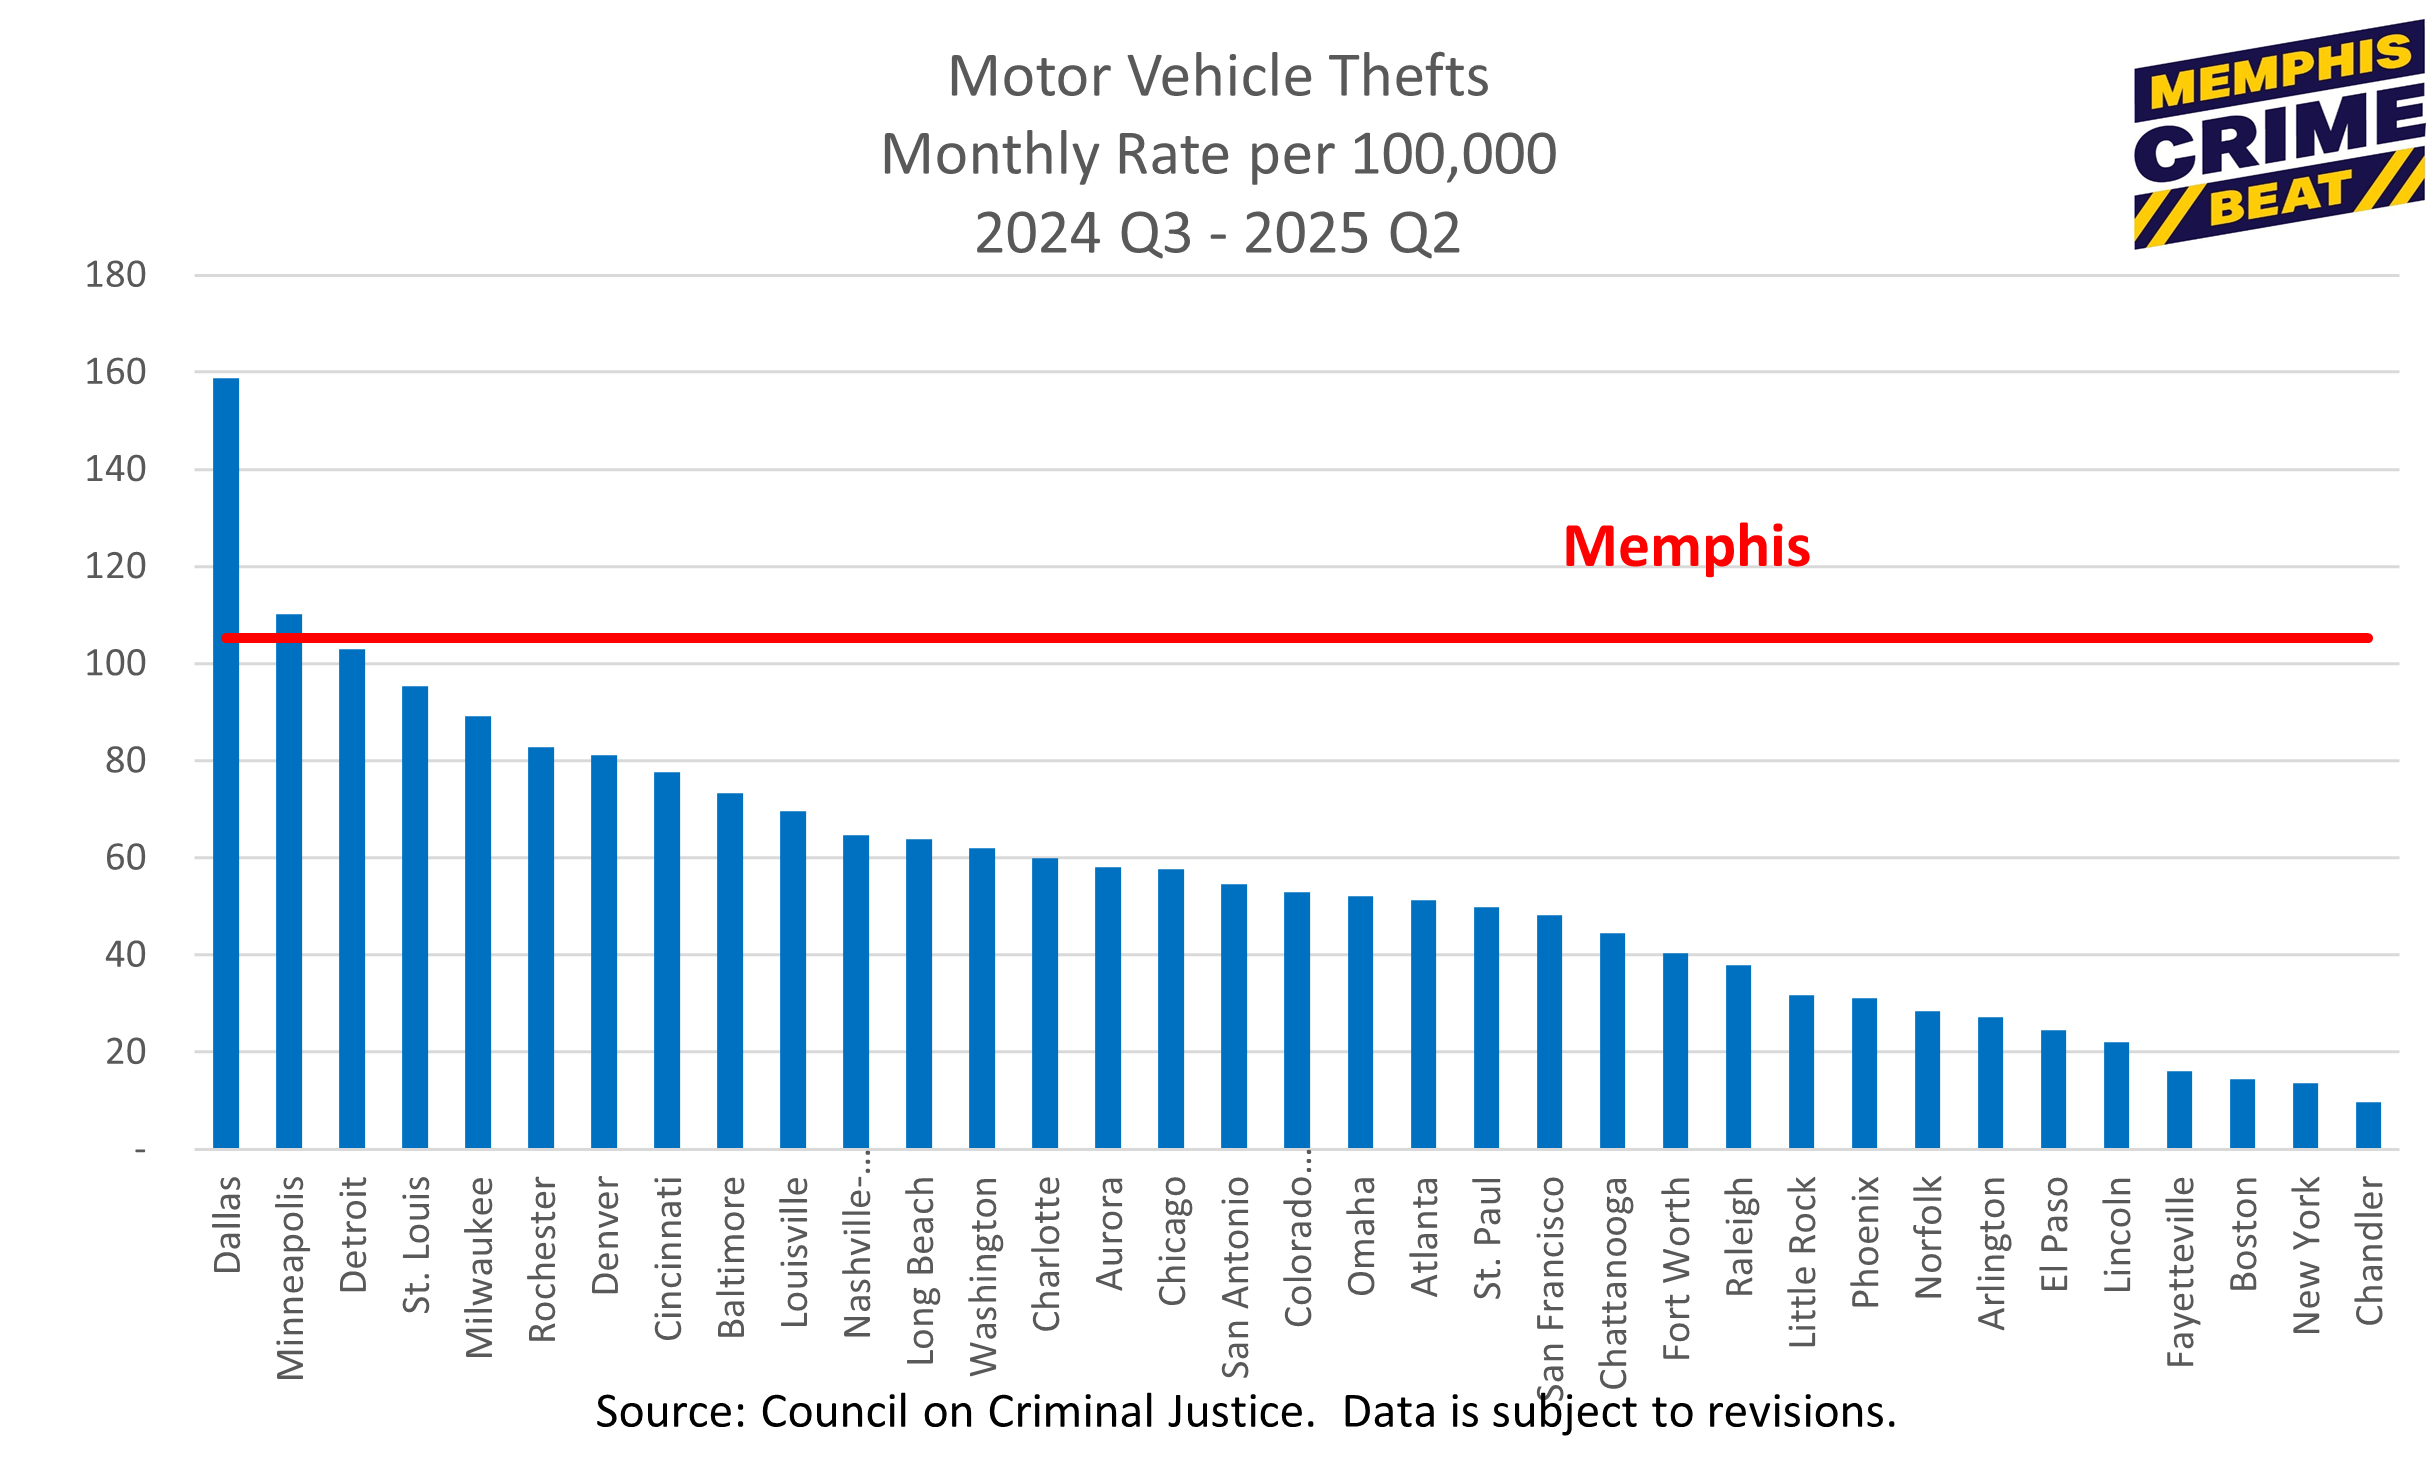
Monthly rate per 100,000 across reporting cities.

Monthly rate per 100,000 across reporting cities.
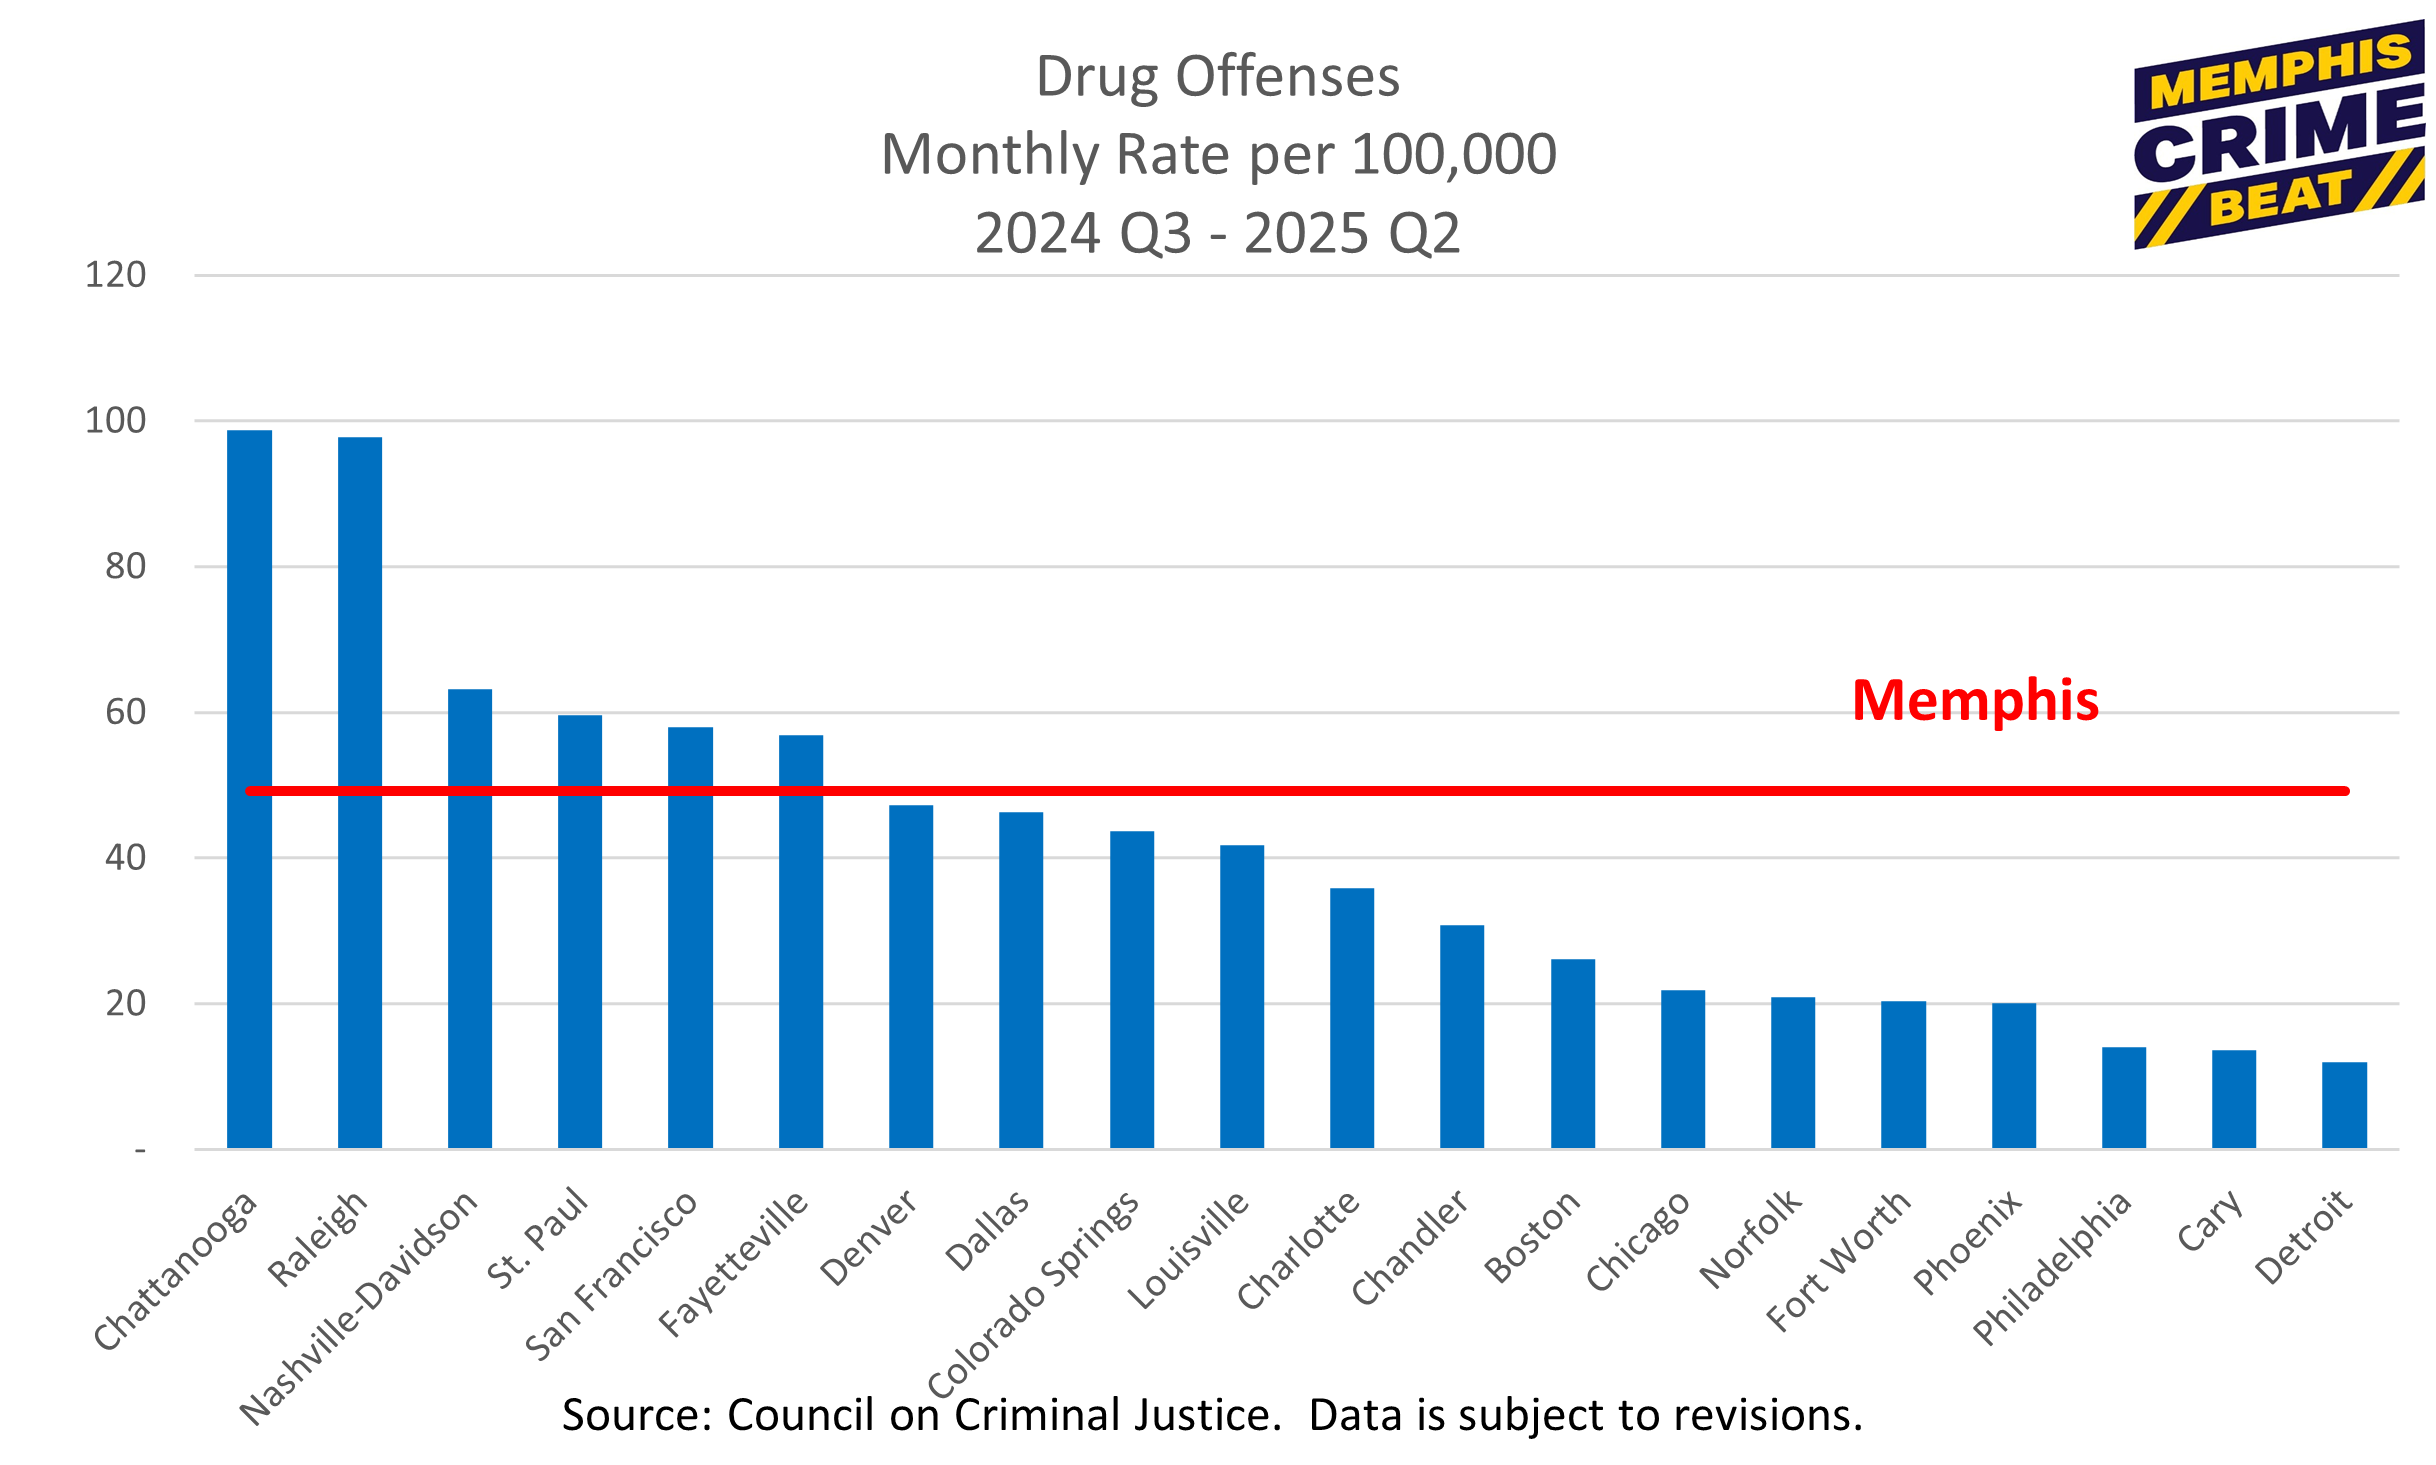
Monthly rate per 100,000 across reporting cities.